Few people in the car audio industry seem to grasp that speakers are typically the weakest link in audio systems, in terms of adding distortion to what we hear. Whether it’s a poor design with improper voice coil centering in the magnetic gap or poor magnetic or compliance linearity, speakers add significant amounts of unwanted information to what we hear. This article will take a deep dive into explaining how increased cone excursion affects distortion.
Understanding Car Audio Speaker Cone Excursion
Speaker cones move back and forth to excite air molecules and produce sound. They function in the same way that hitting the skin of a drum, blowing through a horn or vibrating the string of a guitar creates pressure waves in the air. If we apply more voltage to a speaker, the cone moves more. Reproducing low-frequency information requires that air molecules be displaced further, requiring more cone excursion (and more voltage) to produce bass frequencies. Larger instruments like an upright bass, concert grand piano and timpani also produce more low-frequency information than a banjo, spinet piano or bongo drum.
Unfortunately for speakers, the more their cones move forward and rearward, the more chances there are for the cone to not track the electrical signal perfectly. When this happens, unwanted harmonic information is added to the audio signal. We call this distortion. If the cone, dust cap or surround resonates, this also adds unwanted distortion. It’s not uncommon for speakers playing at moderate output levels to reach well over 1% distortion. This means that more than 1% of the sound they produce doesn’t follow the input signal accurately.
Measuring and Understanding Speaker Distortion
To help explain this concept, I took a popular 6.5-inch PA-style speaker that’s used in car audio systems and mounted it in my test enclosure. I set up my Clio Pocket with the microphone a few millimeters from the cone and performed a series of frequency response sweeps at different power levels. The Clio system can analyze the measurement and display second- and third-order harmonic information. Let’s look at the first measurement in detail.
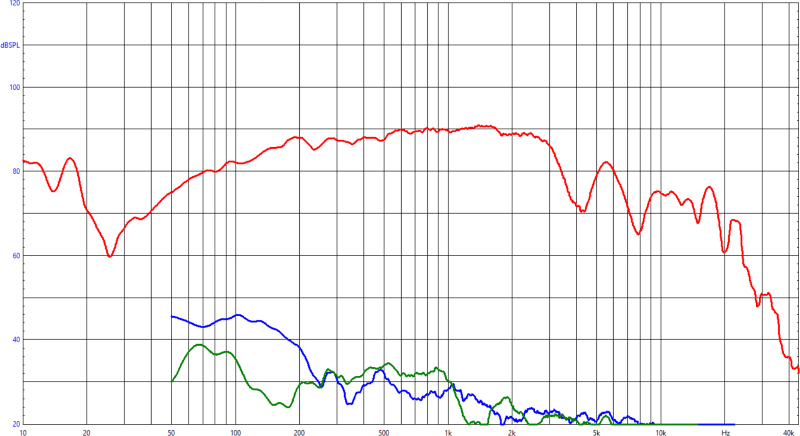
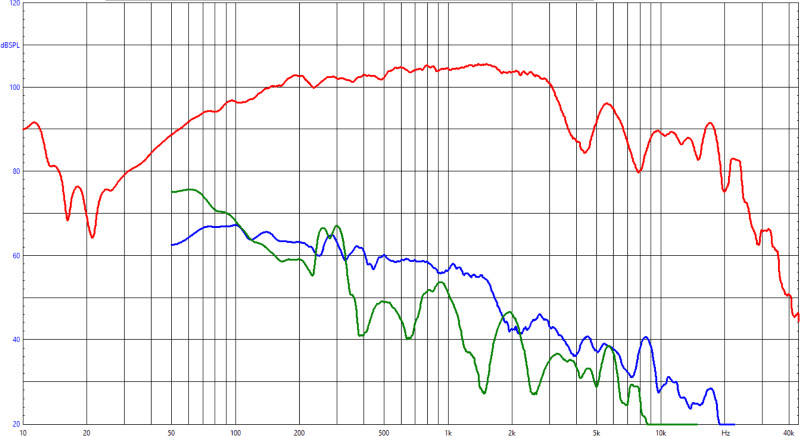
The graph you see above shows three pieces of information. First, the red trace is the frequency response of the speaker. This trace tells us how much energy the speaker produces at different frequencies when fed with a chirp signal. The chirp signal is a sine wave sweep that starts at 20 Hz and ends at 40 kHz. I adjusted the output of the amplifier for this test such that it produced right at 1 volt of output, which is 0.25 watt into a 4-ohm load.
The perfect speaker (which doesn’t exist) would produce a perfectly flat frequency response from the lowest bass frequencies to the highest of high frequencies. This speaker was within about 5 dB of flat from 200 Hz to 3000 Hz. Remember, this measurement is with the microphone right at the cone, so the sound pressure level numbers on the left don’t directly correlate to what you’d hear in a car or truck unless you installed the speaker in your headrest. Uh, please don’t do that.
The blue trace is the second-order harmonic distortion trace. To explain what this information means, let’s look at a specific frequency, 200 Hz. The speaker is producing about 88 dB SPL of output at 200 Hz. This is called the fundamental frequency. The blue trace tells us that it’s also producing a second harmonic (which would be 400 Hz) at a level of 38 dB SPL. Again, the absolute numbers don’t matter, but we need to know that the distortion is 50 dB below the fundamental. That works out to 0.316% for the second-order harmonic.
The green trace is the level of the third-order harmonic, which for a 200 Hz signal is 600 Hz. We have an output of about 29 dB SPL, 59 dB below the fundamental and representing a distortion level of 0.112%.
I’ll reiterate and rephrase this to be precise: If you feed this speaker a 200 hertz signal at a level of 0.25 watt, it will also produce output at 400 hertz and 600 hertz (and many more multiples). This is how speaker distortion works, and it’s common to every speaker of every design, at every price point and from every manufacturer. Finally, better speakers add less distortion – that’s a key part of what makes them better. I deliberately chose this PA-style speaker because it has an extremely short voice coil, so it will be easy to push it into high levels of distortion at low frequencies with minimal power. The purpose is to quantify how distortion increases with cone excursion, not to “test” this speaker.
More Power Means More Distortion
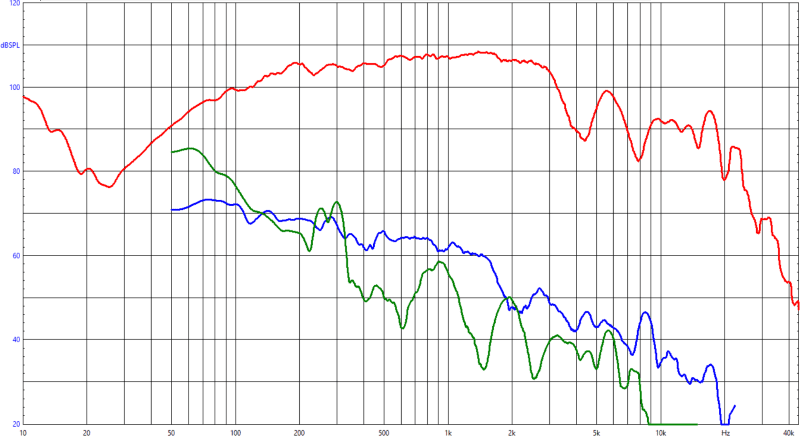
For the next test, I increased the output of the amplifier to 2.83 volts, which works out to 2 watts of power. This added power should correlate to a 9 dB increase in output.
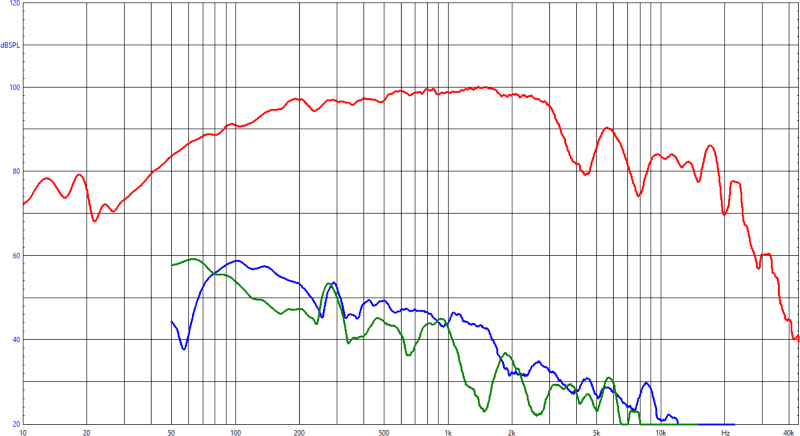
The first thing to notice is that the shape of the frequency response trace (red) didn’t change. Second, the speaker did increase its output by exactly 9 dB. You have to love the laws of physics! What matters in this measurement is that the harmonic distortion has increased significantly. The increase isn’t linear with the increase in output from the speaker. Looking at 200 Hz again, the first harmonic is now at a level of -44 dB relative to the fundamental, which is 0.631% THD. The third harmonic is at 50 dB below the fundamental, which is 0.316% THD.
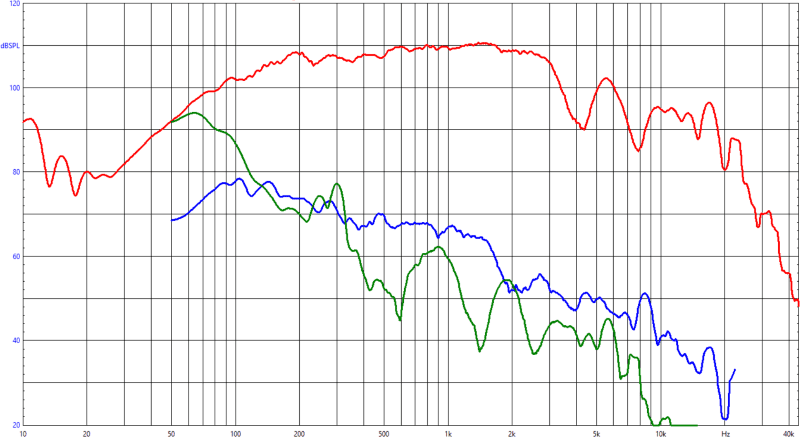
Let’s double the power again to 4 watts and see what happens.
The fundamental has increased another 3 dB as expected. The first-order harmonic content at 200 Hz is at -42 dB relative to the fundamental, which is 0.794% THD. The third-order is 47 dB below the fundamental, which is 0.446%.
Let’s double the power again to 8 watts and repeat the measurements.
The fundamental is right at 103 dB SPL at 200 Hz, and the second harmonic is 40 dB lower at 63 dB SPL. This represents almost exactly 1% total harmonic distortion. The third harmonic is down 44 dB, which is 0.631% THD. We won’t get into the math here, but the total distortion caused by all harmonics wasn’t measured in this test, and you can’t add the numbers directly (e.g. 1.631%).
OK, let’s bump up the power again to 16 watts.
While we continue to focus on the 200 Hz calculations, look what’s happening to the third-order harmonic distortion down below 100 Hz – it’s getting louder very quickly and is actually catching up to the fundamental information. Nevertheless, at 200 Hz, the second-order harmonic output is at 37 dB below the fundamental, which is 1.412% distortion. The third-order distortion is at -40 dB relative to the fundamental, which is 1.0 % THD.
Hopefully, you’re starting to see a pattern. Let’s double the power again to 32 watts and see how the speaker behaves.
We picked up another 3 dB of output across the board. Our fundamental is at 108 dB at 200 Hz and the first harmonic is down only 34 dB, which is right at 1.995% THD. The third-order harmonic output is down 38 dB at 1.259% THD. If you’re getting the feeling the speaker would sound terrible attempting to reproduce audio information at 200 Hz at a drive level of 32 watts, you are right.
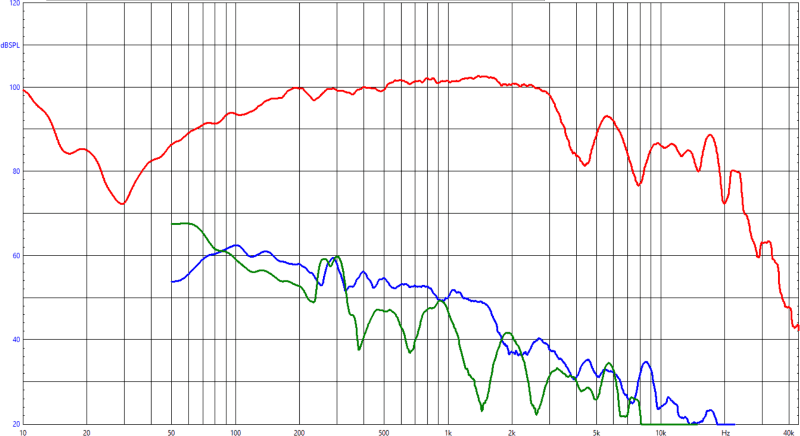
OK, one last time. Let’s double the power again to 64 watts and analyze the frequency response and harmonic content.
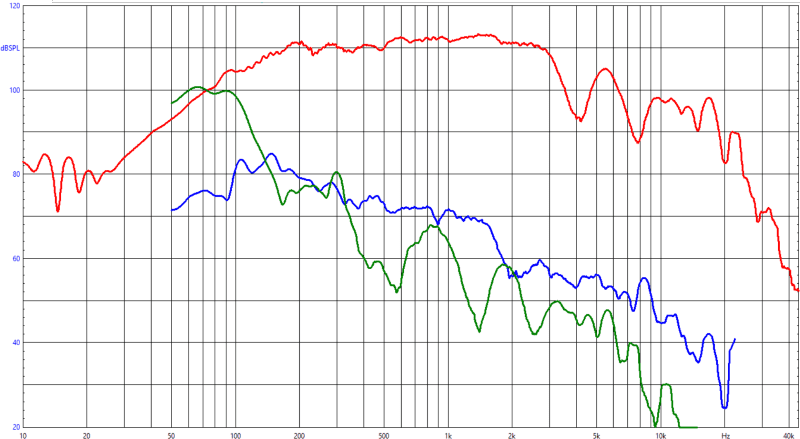
With the fundamental output at 111 dB at 200 Hz, we have 79 dB of output at the second harmonic of 400 Hz, which represents 2.511% THD. The third harmonic output at 600 Hz is at 76 dB, which is 35 dB below the fundamental, or 1.778% THD.
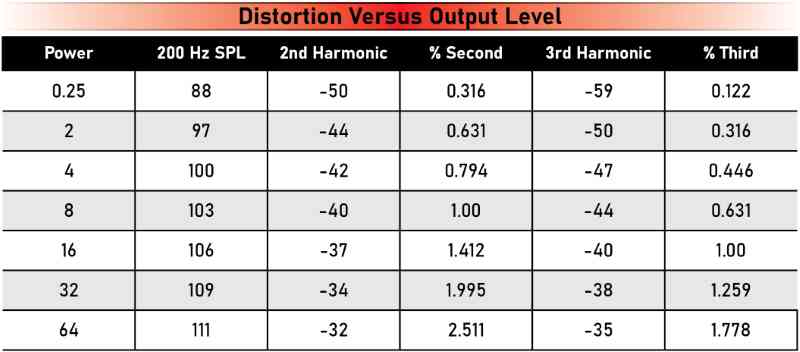
The chart above summarizes the increase in distortion relative to the increase in output. It’s easy to see how the second and third harmonics continue to get louder relative to the fundamental frequency.
Look at what’s happening down at 100 Hz and below. The third-order harmonic output is as loud or louder than the fundamental. When you feed this speaker 64 watts of power at 50 Hz, it produces 93 dB SPL of output (with the mic in this position) and 97 dB of output at 600 Hz. That’s audio information that wasn’t in the music. If you want to do the math, or, more accurately, if you’d like me to do the math, that’s 158% distortion.
What Have We Learned about Speaker Distortion?
There are two takeaways from this first look at car audio speaker distortion. First, the amount of distortion produced by a speaker increases as the cone excursion increases. We should already know from other articles that cone excursion increases at lower frequencies. Putting together these pieces of information tells us that we don’t want to push the smaller speakers in our vehicles to reproduce the bottom two or three octaves of the audible music range. Adding a subwoofer system with a dedicated amplifier and a speaker designed to reproduce low frequencies allows for more bass and can dramatically improve the clarity of the midrange speakers in your audio system.
Second, in general, 6.5-inch PA-style speakers aren’t good at reproducing audio below about 300 hertz. If you understand speaker enclosure design and have modeled this type of speaker using software like BassBox Pro, Leap or Term-Pro, you’ll know that most of these drivers have a -3 dB frequency in the 150 to 200 Hz range. So, pushing this type of speaker to produce audio information below 250 hertz is asking for trouble, or at the very least, lots of distortion.
Choose Your Car Audio Speakers Wisely
If you’re shopping for new speakers for your car or truck, drop by your local specialty mobile enhancement retailer and listen to the options they have available. Suppose you’re the type who likes to correlate features with performance. In that case, drivers that use aluminum or copper shorting rings, feature flat spiders or have a copper distortion-reducing cap on the pole piece are likely to add less distortion than models without.
Look for speakers with cone materials that balance mass with rigidity and damping characteristics – getting any of these wrong is a recipe for trouble. Finally, trust your ears. The speaker should sound smooth and natural with no emphasis anywhere in the frequency range, especially in the bass region. If they sound good on a display compared to the rest, they are a good choice for your car or truck.
This article is written and produced by the team at www.BestCarAudio.com. Reproduction or use of any kind is prohibited without the express written permission of 1sixty8 media.

Leave a Reply