Though it might surprise you, human hearing is significantly more sensitive to some frequencies than others. You can think of this phenomenon as our built-in frequency response. However, unlike a speaker or amplifier, variations are not something we want to compensate for in an audio system—at least, not directly. Let’s discuss how human hearing works with respect to different frequencies and why we need to compensate for this when making sound or product specification measurements. All of this will tie together perfectly with an explanation of weighting curves.
Human Hearing and Frequency Response
Did you know that human hearing is most sensitive around 3.5 kHz? This is due to the dimensions of the ear canal, which typically resonate between 2 and 5 kHz. Even a faint sound at 3.5 kHz is easy to detect. A sound might need to be 10 dB louder at 350 hertz to be perceived as having the same loudness.
In 1933, Harvey Fletcher and Wilden Munsen performed a set of measurements to quantify human hearing concerning frequency and intensity perception. Their paper, “Loudness, Its Definition, Measurement and Calculation,” included what became known as the Fletcher-Munson curves.
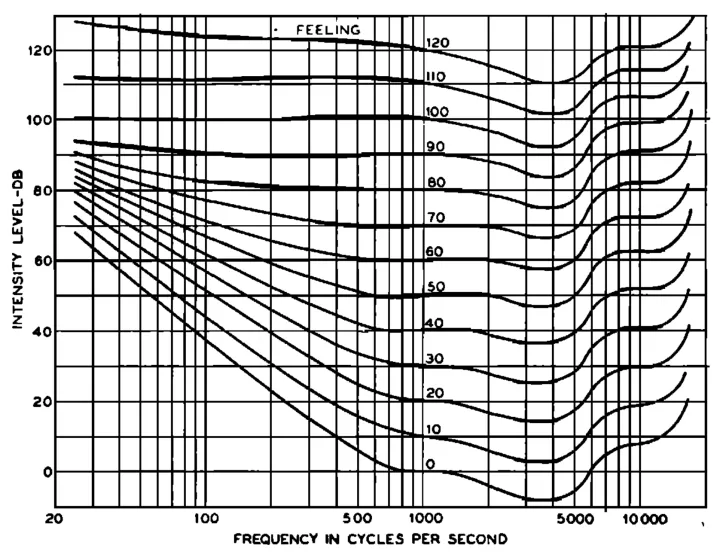
The lines on the chart are separated into amplitude levels called Phons. The Phon is the unit of measure used to describe sounds perceived as equal in intensity. As such, they follow the equal loudness level contours proposed by Fletcher-Munson and subsequent iterations.
It shouldn’t be surprising that the test equipment used to generate test tones wasn’t as precise in 1933 as it is today. Similar testing in 1937 by Churcher and King and again in 1956 by Robinson and Dadson produced significantly different results.
Introducing the Equal Loudness Level Curves
The International Organization for Standardization (ISO) took over the creation of reference loudness curves in 2003. A study by Tohoku University, Japan, and the Research Institute of Electrical Communication showed errors as large as 15 dB from the original data. These new tests became the ISO 226:2003 Standard. Don’t think it’s over yet. These have since been revised again to the ISO 226:2023 Standard.
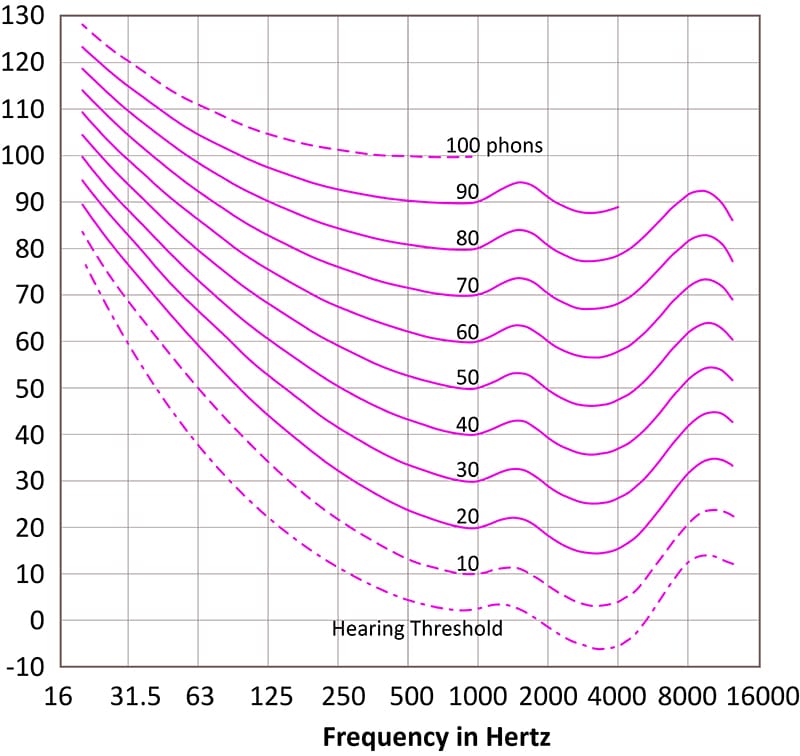
Of course, the above curves are averaged across a wide selection of people of different shapes and sizes. Everyone’s hearing will be slightly different in the areas where it is most sensitive. However, this data provides an excellent overview.
If anyone references the Fletcher-Munson curves, they are at least four generations behind in their data. When discussing the perception of sound levels versus frequency, the proper reference is the ISO 226:2023 Equal Loudness Level Curves.
Interpreting Equal Loudness Level Curves
If you look at the 1 kHz point on each trace, you’ll see that this point coincides with the reference SPL value. So, a sound at 70 dB at 1 kHz is perceived as being at 70 Phons. However, it takes about 74 dB of energy at 1.5 kHz to seem as loud. Further, it takes only 67 dB of energy at 3 kHz to seem as loud.
What matters here are the extreme ends of each trace. We can make some generalized assumptions about human hearing based on the reduced sensitivity in these regions. Staying with the 70 dB trace, we would need to hear a sound that’s 83 dB at 10 kHz to be perceived as being as loud as 70 dB at 1 kHz. Further, a sound at 93 dB at 63 hertz is also perceived to be as loud as 70 dB at 1 kHz.
Though we haven’t consulted with an audiologist (yet), the issue is less about attenuation at opposite ends of the audio spectrum and more about an increase in sensitivity in the middle. As mentioned, the ear canal resonates around 2 to 5 kHz. Furthermore, the outer ear, called the pinna, also amplifies sounds in this frequency range.
The middle ear bones, the ossicles, are more efficient at transmitting mid-frequency sounds. An effective impedance mismatch between the air and the fluid in the cochlea further accentuates this frequency range.
There are additional mid-frequency sensitivities in the cochlea due to where different frequencies peak.
Audio System Equalization
We’ve seen many amateurs try to equalize their audio systems, more often in a home environment than in a vehicle, to compensate for the shape of these curves. That’s not the purpose of the information. Our perception of hearing is static. In short, we hear what we hear. We accept that the sound of a trumpet or saxophone is what it is. We don’t want to change that presentation to compensate for being more sensitive in one range versus another.
There is an exception to this statement. Regarding headphones and earbuds, flat response doesn’t sound accurate. This is because we’ve eliminated some of the frequency filtering caused by the pinna. As such, a modified response curve sounds best. The team at Harman International has devoted significant time and expense to creating a target curve for headphones based on similar experimentation that created the Equal Loudness Level Curves.
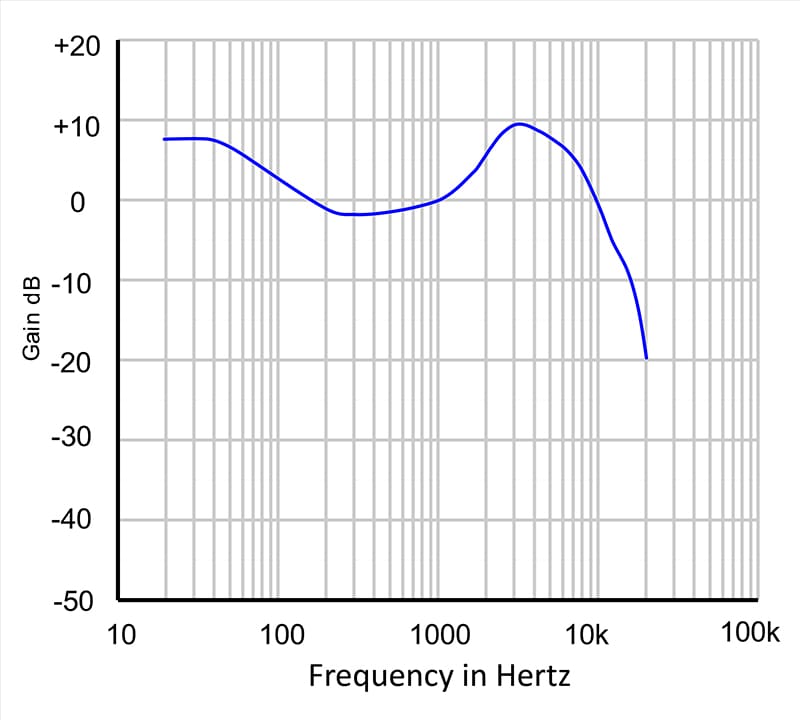
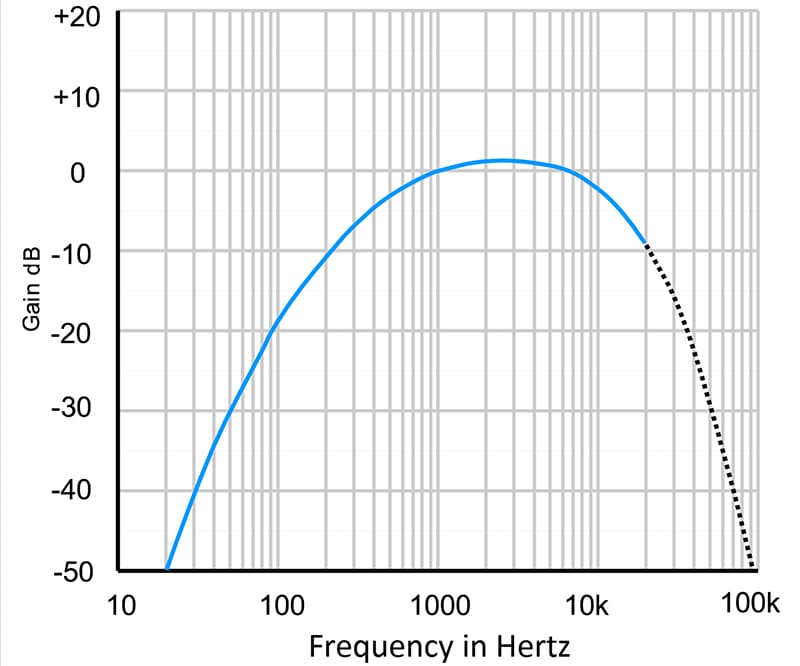
Analyzing Headphone Target Frequency Response
There are two critical pieces of information to extract from the above response graph. First, we can see the boost around 3.5 kHz that coincides with the boost the pinna of our ears adds. Without this, headphones would sound dull and flat. Second, there is a boost in low-frequency information. Part of this will be due to the Equal Loudness Level Curves, and part will be listener preference. We all know that many people prefer bass information boosted in their listening systems. The Harman headphone curve combines the science and mechanics of human hearing with extensive listener preference. They even have details on the percentage of people who prefer more bass and less bass.
Harman uses very specific test equipment to measure headphones. Specifically, a head and torso simulator accurately and repeatably simulates how humans perceive sound.
It’s worth noting that Harman has revised its target curve from the one shown above. Unlike this first iteration, they are not releasing this new curve to the public for endless debate and whining (insert sarcastic wink here!). They will use it to fine-tune the performance of their AKG, Mark Levinson, Harman Kardon, and JBL consumer and professional products.
Speaker Evaluations in Free Field Conditions
If we measure the frequency response of a conventional loudspeaker using a sine sweep or pink noise, we should end up with a fairly flat line, assuming the speaker can play from 20 Hz to 20 kHz with good accuracy. Most floor-standing home speakers roll off below 30 Hz. It would be best to have a dedicated subwoofer to fill in that bottom octave.
The chart below represents a nearly perfect speaker’s ideal frequency response. Do you think if we suck up to KEF enough that they will loan us a set of Blade 2 Meta to use as our reference review speakers? Here’s hoping!
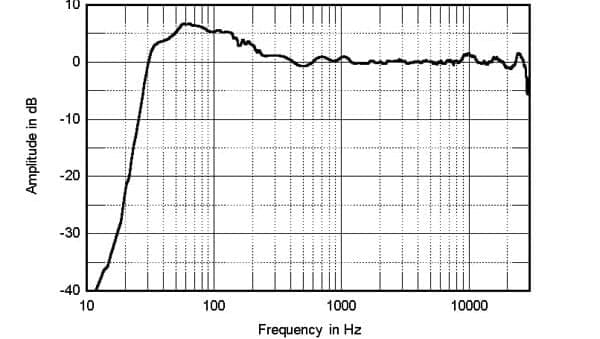
As noted in Stereophile Magazine’s review of the Blade 2 Meta, the boost in the bass is primarily due to the close-micing technique used for measurements.
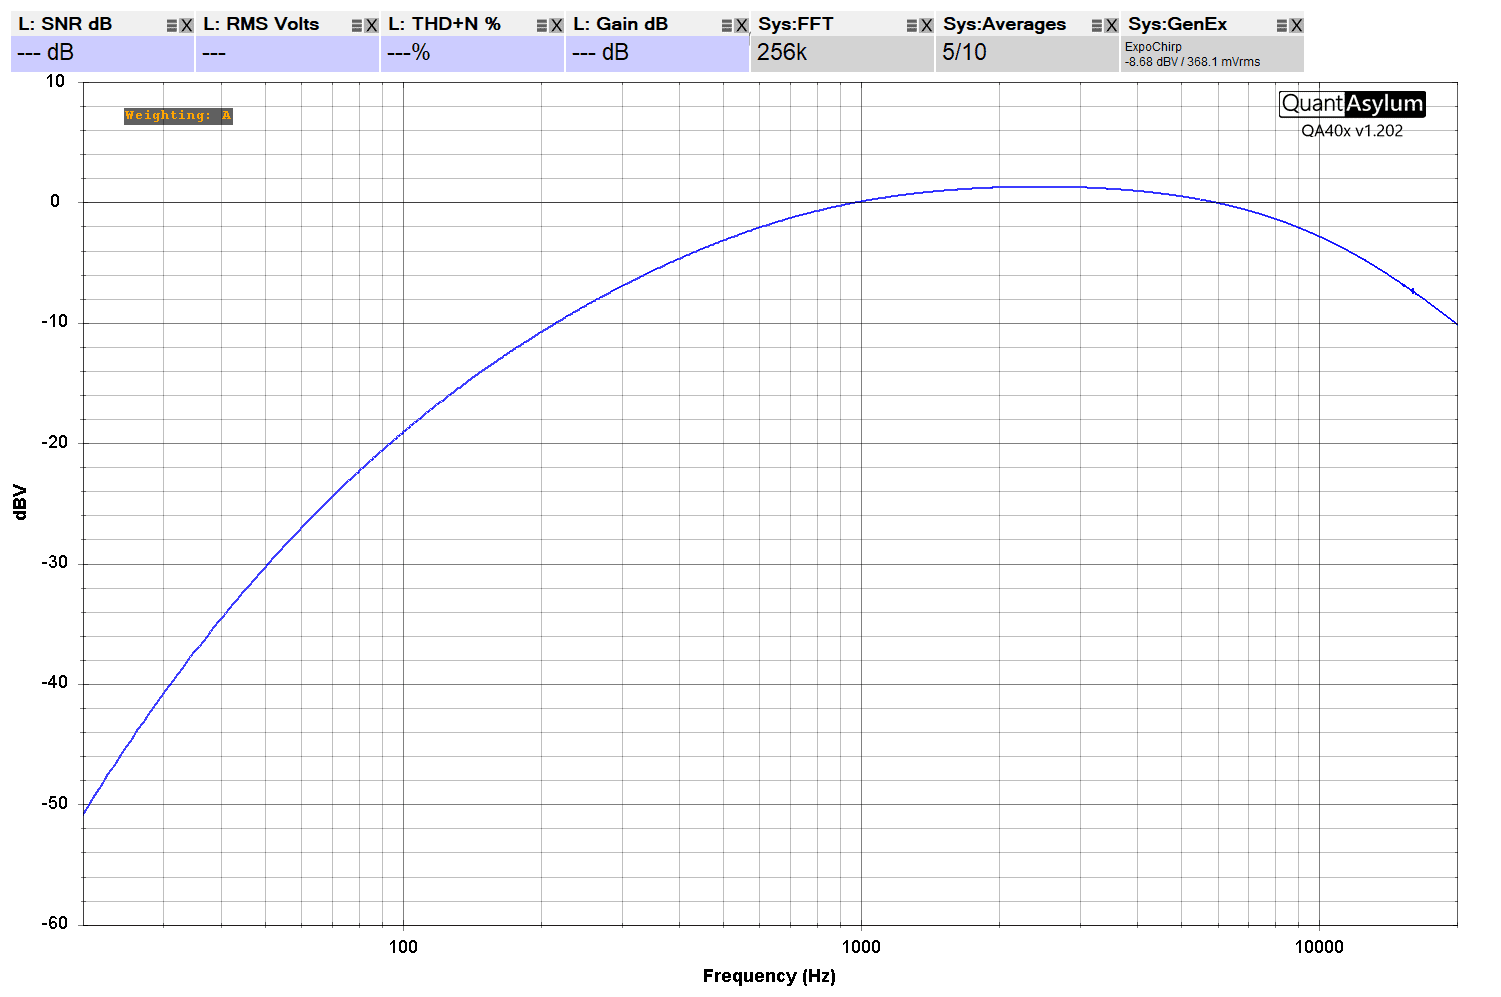
A-Weighting Curves in Measurements
Let’s get to the nitty-gritty of this article. Look at the Equal Loudness Level Curve chart above and analyze the 40-phon trace. Information similar to this was used to create what’s known as the A-weighting curve. This curve is intended to be applied to a sound pressure measurement so that the energy in the measurement correlates to how we hear. It was actually the Fletcher-Munson 40-phon curve that was used to create the A-weighting curve. Thankfully, the ISO 233-2032 40-phon curve is quite similar.
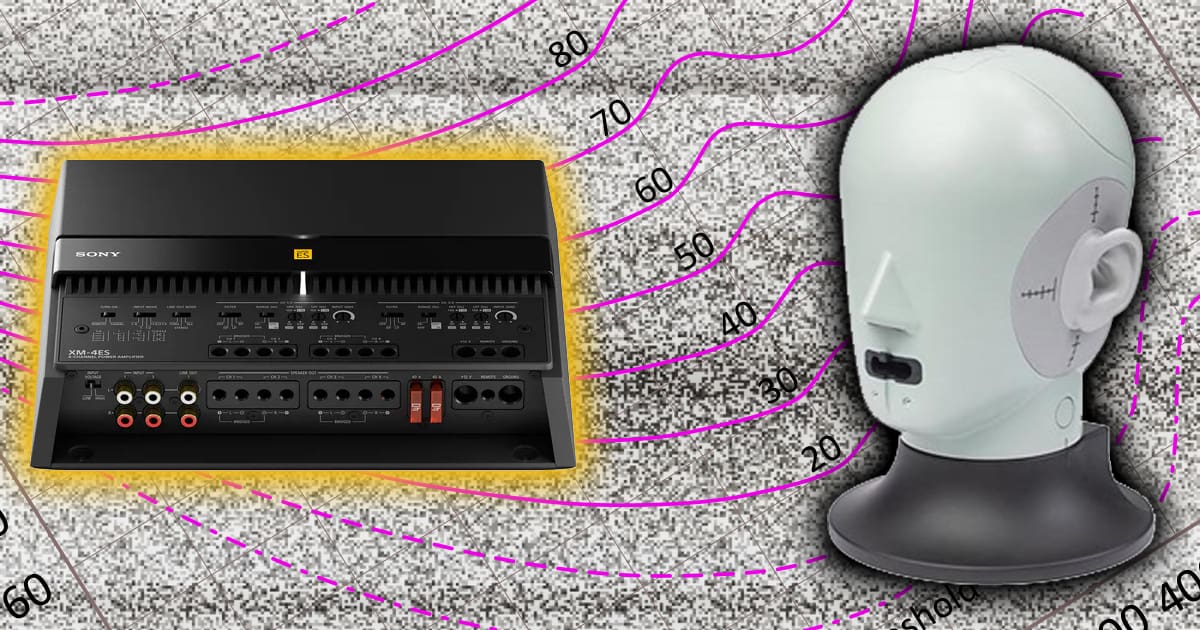
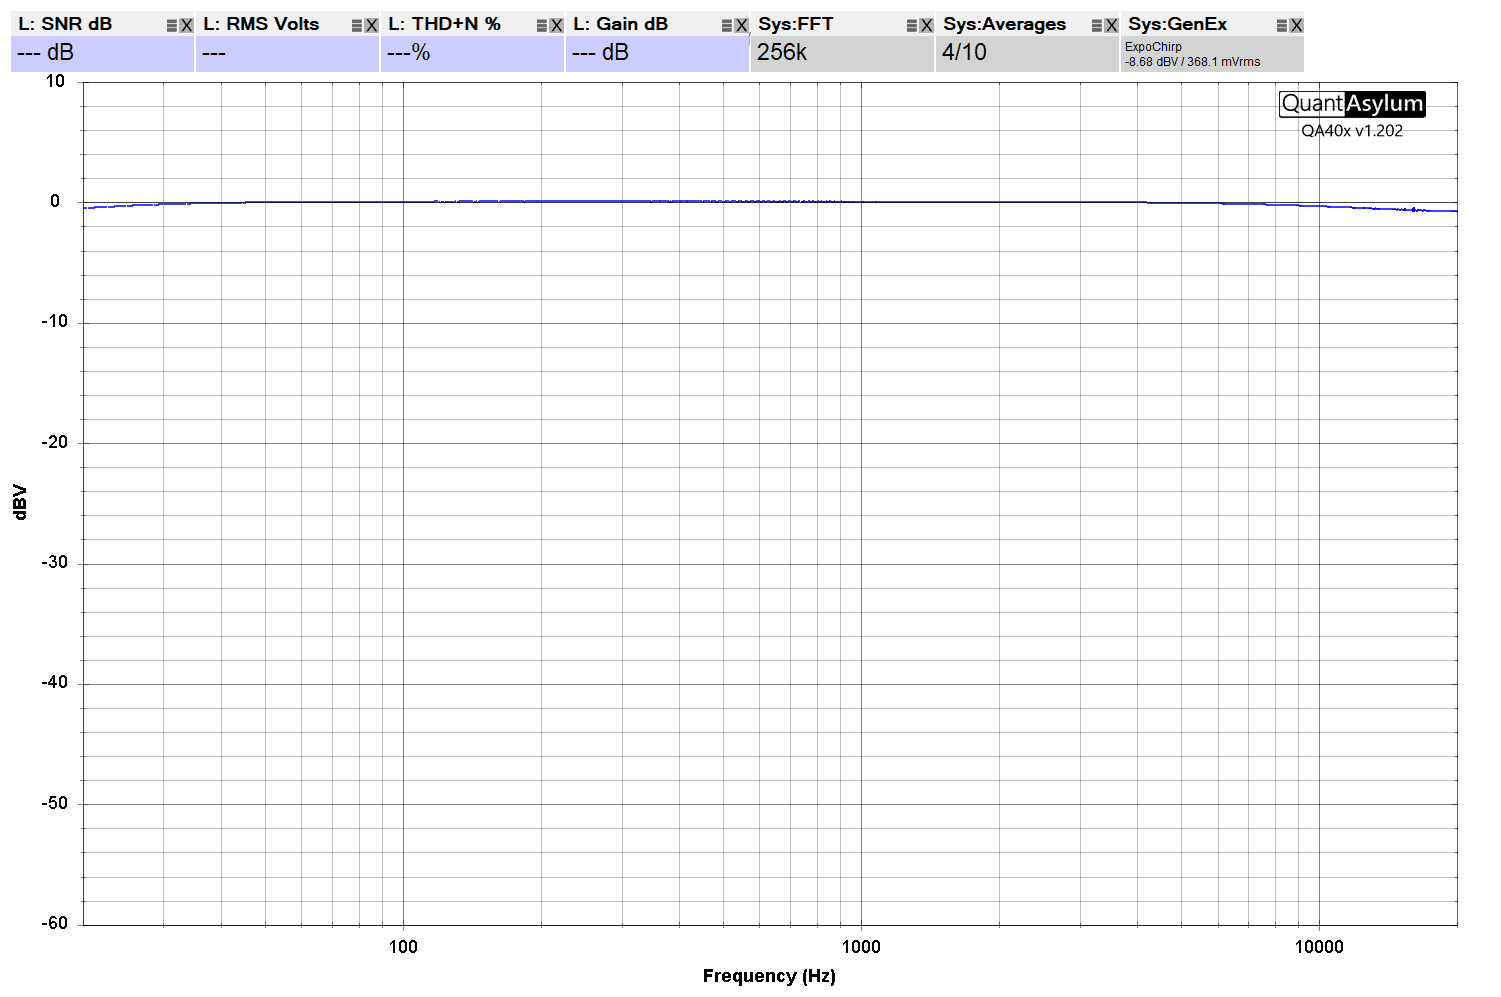
To show you the same data in a format you might be more familiar with, we dug out the Sony XM-4ES amplifier we reviewed a few years back. We performed a frequency response test with all the settings flat and again with the A-weighting filter activated in the QuantAsylum software.
Where We Use Weighted Measurements
The ANSI/CTA-2006-D standard for measuring car audio amplifiers calls for applying the A-weighting curve to the measurement after the reference level is set. Up to this point, we’ve shown the measurements as unweighted. The result is slightly lower values, indicating the presence of more noise. As we move to further comply with ANSI/CTA-2006-D, we’ll start using the A-weighting curve to evaluate the signal-to-noise ratio of the source units’ amplifiers and signal processors we test.
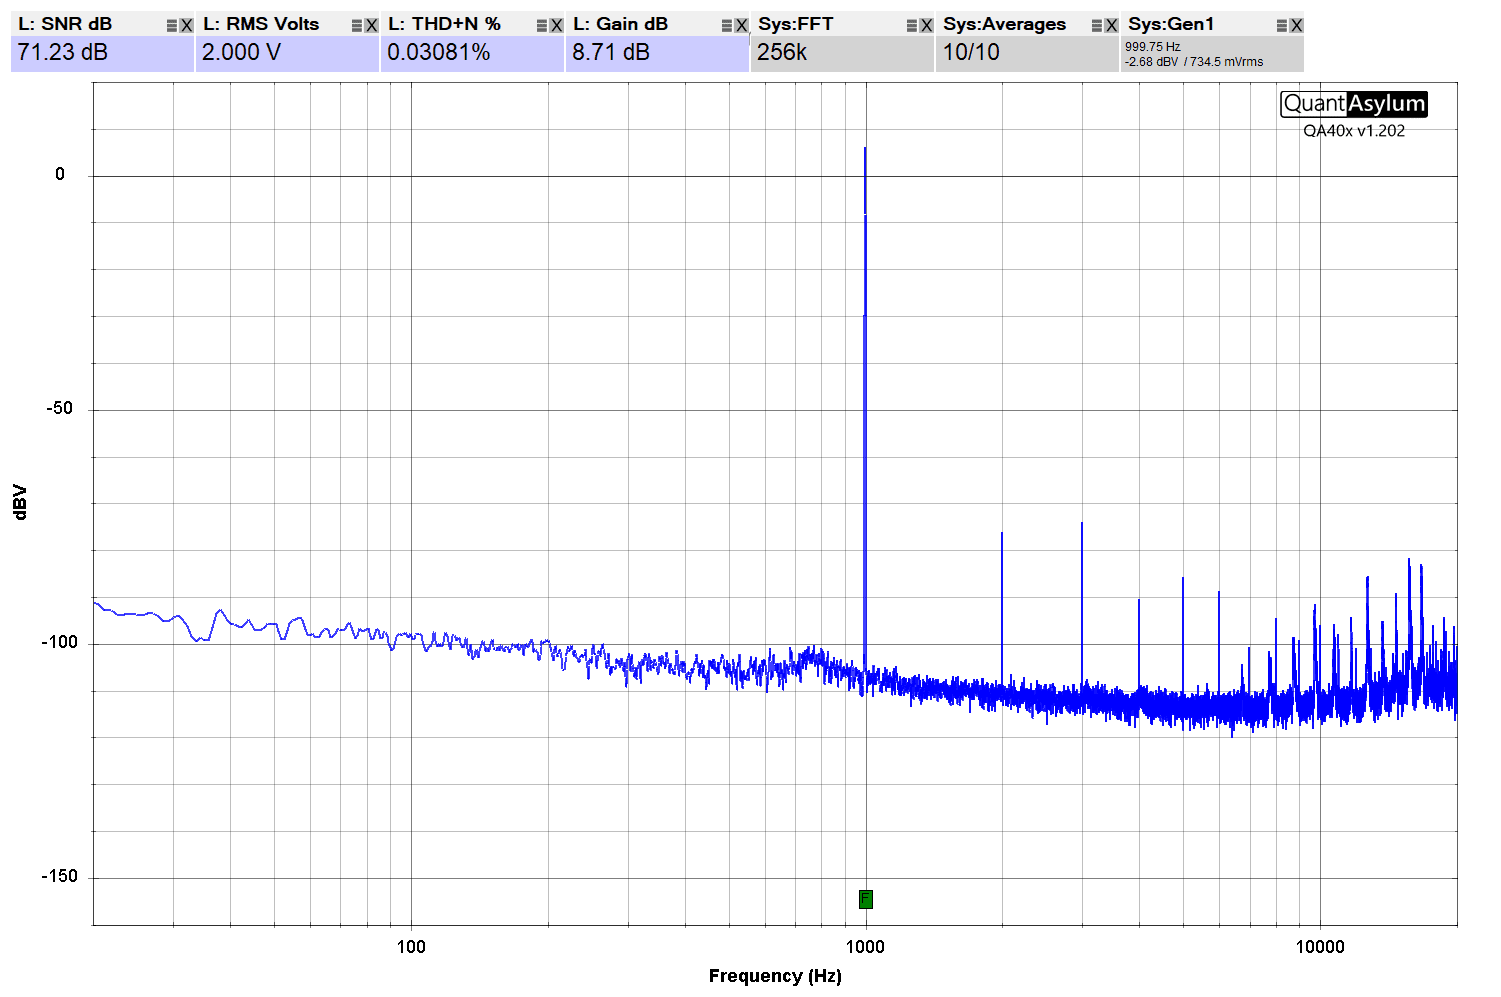
We can see that the Signal-to-Noise Ratio measurement of this Sony XM-4ES amplifier is specified as being 71.23 dB.
Now, if we turn on the A-weighting filter and apply it to the measurement, the low- and high-frequency information is attenuated, which reduces its effect on the measurement.
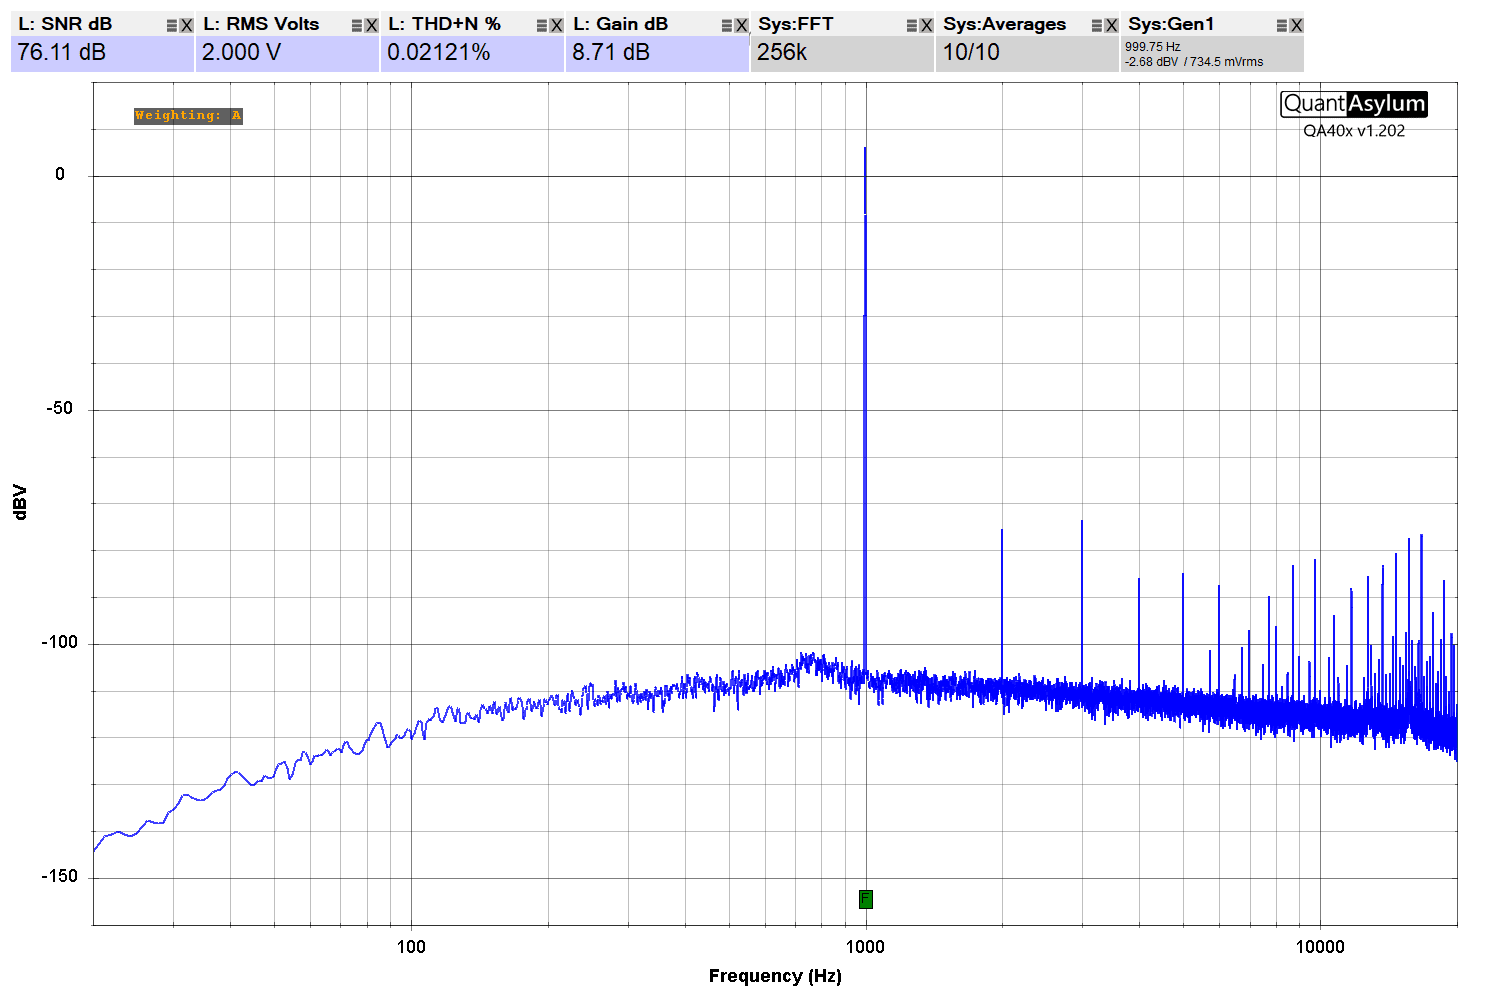
The QuantAsylum software has revised the SNR measurement to -76.11 dBA. The addition of the letter A after dB indicates the use of A-weighting. Given the published measurements on the CTA TECH website, which show -76.5 dBA for the XM-8ES and -80.8 dBA for the XM-6ES, we are comfortable saying our data aligns with those numbers.
So, the next time you see a signal-to-noise ratio measurement with the amplitude specified in dBA, you will understand how and why that rating system is used. Finally, a higher SNR number means that the noise is further below the test signal. A level of -75 dBA is about the minimum you’ll want to consider for an amplifier in a car audio system that will drive midrange and high-frequency speakers.
This article is written and produced by the team at www.BestCarAudio.com. Reproduction or use of any kind is prohibited without the express written permission of 1sixty8 media.

Leave a Reply